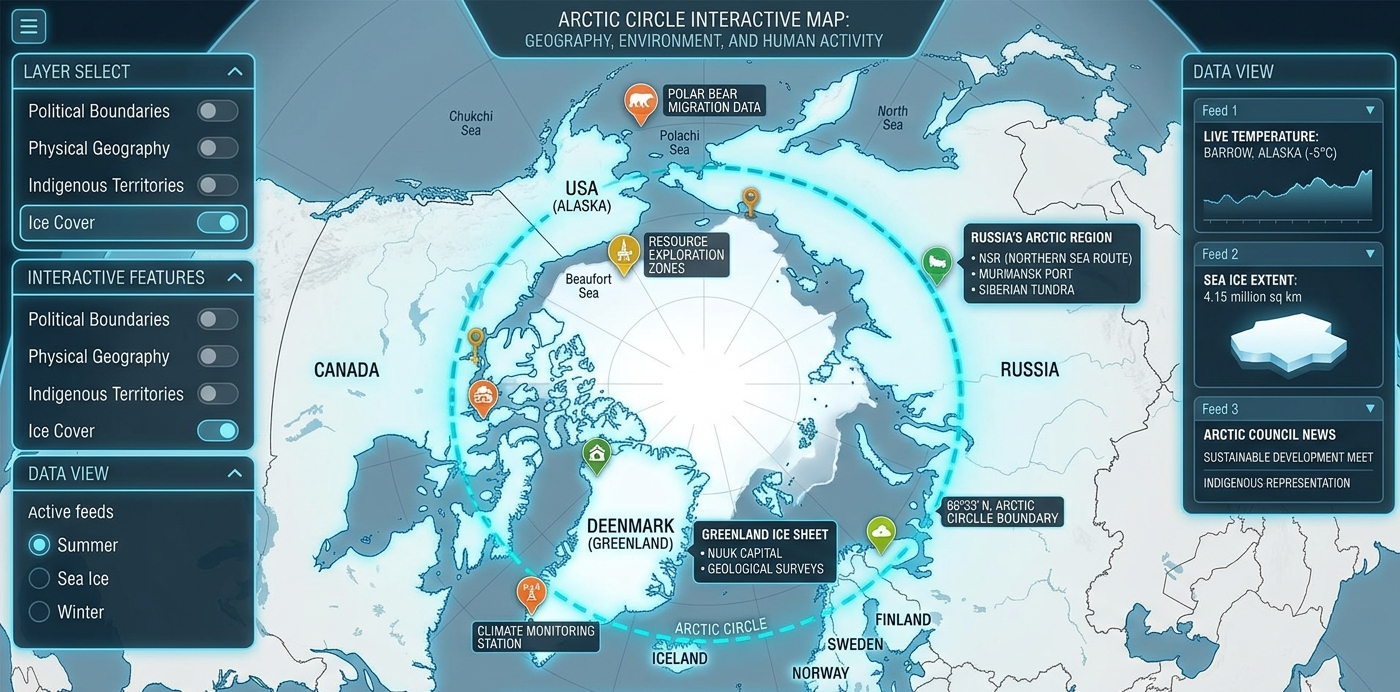
August 17, 2026 — I opened an Arctic Circle interactive map today, and the far north suddenly felt much less distant to me. I could follow the famous latitude line, move across countries, and see how the Arctic connects land, ocean, islands, and people. It looked simple at first, but every small movement on the map revealed something new about this cold and unusual part of Earth.
The Arctic Circle is not a wall or a border that anyone can see from an airplane. It is an imaginary line of latitude located at about 66.5 degrees north. National Geographic describes it as one of Earth’s major latitude lines and explains that it marks the region where the Sun can remain above the horizon around the June solstice or below it around the December solstice.
When I moved across the map, I noticed how enormous the Arctic really is. The line travels around the northern part of the planet. It passes through or reaches territories connected with eight countries, including Norway, Sweden, Finland, Russia, the United States, Canada, Greenland, and Iceland.
That is where an interactive map becomes more exciting than a normal picture. A printed map gives me one view, but an interactive version can let me zoom, move, select locations, and examine the Arctic from different angles. Suddenly, places that looked like tiny marks on a classroom map can become real destinations with names, landscapes, communities, and stories.
I first looked toward Scandinavia. Norway appeared along the western side of the Arctic region, followed by Sweden and Finland farther east. The map made the northern geography easier for me to understand because I could visually follow the line instead of trying to remember every location from a list.
Then the map stretched across Russia. It was almost surprising to see how far the Arctic Circle travels through the country. Russia contains a huge portion of the northern land area, and its Arctic coastline is also extremely important to the wider Arctic region. The Woods Hole Oceanographic Institution notes that Russia accounts for about 53 percent of the Arctic coastline.
From Russia, my attention moved toward Alaska and Canada. The Arctic Circle crosses northern parts of North America before reaching Greenland and the waters around the North Atlantic. Seeing the route on a digital globe makes the distance feel different. What looks like separate places suddenly becomes one connected northern world.
Greenland is especially interesting when viewed on an Arctic map. Much of the island lies inside the Arctic region, and its position between Canada, Iceland, and the rest of the North Atlantic gives it an important geographic location. A 2026 interactive map feature from Al Jazeera also highlights Greenland’s strategic position and shows how close some Arctic territories are to one another.
I also found Iceland fascinating. The country’s mainland sits mostly south of the Arctic Circle, while Grímsey, a small island north of the Icelandic mainland, is crossed by the Arctic Circle. That tiny detail can be easy to miss on a traditional world map. An interactive map can make such details much easier to notice.
The most surprising part for me was realizing that the Arctic Circle is not simply a line drawn to make maps look interesting. It has an astronomical meaning. Near the June solstice, locations on and north of the circle can experience a period when the Sun does not set, while during the December solstice the opposite effect can occur.
This is the famous polar day and polar night. Farther north, the effect becomes even stronger. At the North Pole, the Sun can remain above the horizon for roughly half the year and below it for roughly half the year. The interactive map cannot make me feel the cold or darkness, of course, but it helps me understand where these extreme changes happen.
I zoomed farther toward the North Pole and the map began to look very different. There were fewer roads and cities. Vast areas became ocean, ice, islands, and remote territory. This is one reason Arctic maps can be so useful for students, travelers, researchers, and anyone trying to understand the geography of the far north.
The Arctic is also changing, and that makes digital maps more important. Scientists use mapping systems and satellite observations to study sea ice, land, temperature, wildlife habitats, shipping routes, and other environmental changes. The European Space Agency has described interactive climate tools that allow people to explore satellite observations and see how Earth’s climate has changed over decades.
Another useful example comes from Arctic research mapping. The Arctic Research Mapping Application provides mapping services and layers for Arctic countries and geographic information. These systems show that interactive mapping is not only a fun way for the public to explore the region. It is also an important tool for scientific and geographic work.
For me, one of the best things about an interactive Arctic map is the ability to compare places. The journey takes only seconds on a screen, even though the real distances are enormous.
A map can also change how I think about Arctic countries. The Arctic is not owned by one nation. Different countries and territories have land, waters, communities, and interests in the region. National boundaries, Indigenous territories, shipping routes, research areas, and environmental zones can overlap in ways that are much more complicated than a simple circle on a globe.
The map also reminds me that the Arctic is not empty. Millions of people live across the broader Arctic region, including Indigenous communities whose histories and cultures are closely connected to the northern environment. Cities, villages, roads, airports, mines, ports, research stations, and tourism centers can all be found across different parts of the Arctic.
Then there is wildlife. When I think of the Arctic, I immediately picture a polar bear walking across sea ice. But the region has much more than polar bears. Arctic foxes, reindeer and caribou, seals, whales, walruses, seabirds, and many other species live in or travel through northern ecosystems.
An interactive map can help connect these animals to their environments. A location near the Arctic Ocean is not the same as a tundra landscape farther inland. Sea ice, coastal areas, wetlands, mountains, rivers, and tundra each create different conditions. When I see these places on a map, the Arctic starts to feel like many worlds inside one giant region.
The geography becomes even more interesting when I compare the Arctic Circle with the Antarctic Circle. Both are major latitude lines near the poles, but they surround very different environments. The Arctic is largely an ocean surrounded by continents and islands, while Antarctica is a continent surrounded by ocean.
That difference matters. On an Arctic Circle interactive map, I can see land spreading around the northern ocean. In Antarctica, the visual story is almost reversed. The continent dominates the center, with the Southern Ocean around it.
Another detail caught my attention. The exact position of the Arctic Circle is not perfectly fixed forever. Its location is linked to Earth’s axial tilt, which changes slowly over long periods. One interactive mapping resource estimates the line at about 66.5606 degrees north and explains that its position shifts gradually.
That makes the phrase “the Arctic Circle” sound much more interesting to me. It feels like a permanent line, but the planet itself is always moving. Earth rotates. Earth orbits the Sun. Its axis changes slowly. Even a line that looks completely fixed on a map is connected to a moving planet.
Modern maps can also show more than geography. They can include political borders, satellite imagery, climate information, ocean data, roads, settlements, and other layers. With the right data, a user can switch between views and understand the same region from different perspectives.
This matters because Arctic news is rarely about geography alone. Climate change, sea ice, shipping, tourism, energy, wildlife, science, and international relations are all connected to the northern region. A map gives readers a visual starting point before they begin reading about these complicated subjects.
The Arctic shipping story is a good example. As sea-ice conditions change, ships and researchers pay close attention to northern waters. Interactive mapping can help show where waterways are located, how far they stretch, and how they relate to countries and ports. It does not replace detailed navigation systems, but it can make the larger geography easier to understand.
Tourism is another part of the story. Travelers visit northern Norway, Finland, Sweden, Iceland, Greenland, Alaska, and parts of Canada to experience snow, mountains, wildlife, the midnight sun, and the northern lights. Looking at an interactive map before a trip can make the distances and locations much clearer.
I also think students could find this kind of map useful. Instead of memorizing eight country names from a textbook, a student can click around and discover where each one sits. Geography becomes something to explore rather than something to simply remember.
For news readers, the same idea works. If a headline mentions Greenland, the Northwest Passage, northern Russia, Alaska, or the Arctic Ocean, I can open a map and immediately place the story in context. That tiny action can change how much I understand from the article.
The Arctic Circle itself may look like a simple curved line on a screen. Yet behind that line are huge questions about nature, climate, people, science, travel, and the future. The more I explored the map, the less it looked like an empty white space and the more it looked like a living region.
Digital maps are also becoming more detailed. Official geographic services can provide dedicated Arctic Circle layers, including a specific Arctic Circle feature layer from the U.S. National Oceanic and Atmospheric Administration’s geographic information system.
That means today’s map is not just a drawing made for decoration. Geographic information can be connected to databases and updated layers. A person can use the visual line while researchers can work with geographic data underneath it. One screen can therefore serve both curiosity and serious research.
I found another useful lesson in this. A map does not tell the whole story by itself. It shows where something is, but it may not explain how people live there or how the environment is changing. For that, I still need reliable reporting, scientific research, local knowledge, and historical information.
Still, the map gives me the first question: where exactly is this place?
That question sounds small, but it is powerful. When I know where a place is, I can begin to understand its weather, landscape, people, wildlife, transport, history, and importance. The Arctic Circle interactive map turns that first question into an exploration.
On August 17, 2026, the Arctic may still seem incredibly far away to many people. I cannot simply walk to the North Pole from my home. But with an interactive map, I can cross the entire Arctic Circle in moments, moving from Scandinavia to Russia, across northern waters, toward Alaska and Canada, and onward to Greenland and Iceland.
And that is the real surprise for me. The Arctic Circle is an imaginary line, but the world around it is very real. Every click on the map can reveal another country, another island, another ocean, another community, or another piece of a rapidly changing northern story.
The simple line on the screen suddenly becomes a doorway. I start with geography, then I find climate, wildlife, people, science, travel, and history waiting behind it. For anyone curious about Earth’s far north, an Arctic Circle interactive map is no longer just a map to look at—it is a way to explore the Arctic one location at a time.
✍️ Written by Vimal Bhagat
🌎 Sharing fresh news, trending stories & interesting updates from around the world.
💙 Read more: arcticcircle.us

Pingback: Detailed Map of Arctic Circle: The Hidden Line Across 8 Countries Is More Amazing Than Most Maps Show — Arctic Circle